

DATADRIX : Advance Excel
Enhance Data Analysis, Automation, and Visualization
Our Advanced Excel course is designed to take your spreadsheet skills to the next level. Whether you’re a working professional looking to enhance your data analysis and reporting capabilities or an Excel enthusiast eager to dive deeper into the world of functions, formulas & advanced data visualization, this course has you covered. You’ll learn to automate tasks, build complex models, and unlock the full potential of Excel as a powerful tool for business analysis and decision-making. Our experienced instructors will guide you through the intricacies of pivot tables, lookups, and advanced data manipulation techniques. By the end of the course, you’ll be equipped with the expertise to handle complex data-driven challenges.
Course Curriculum
A syllabus is a meticulously crafted document that serves as a comprehensive roadmap for the training program. It plays a pivotal role in guiding candidate along their learning journey, offering a structured framework for acquiring knowledge and honing skills.
Module 1
Module 2
Module 3
Module 4
Internship Program
This internship is a part of the course curriculum to help you gain real experience in the Data Science domain.During this internship, you will go through various challenges which you allow to explore new skills and push your limits while learning something new during the projects.
Topics Covered :
Integration of python & SQL
Web Scrapping
Data Cleaning with Python
Model Evaluation
Git / Github Integration
End to End Projects
Interview Preparation
Datadrix offers top-notch placement opportunities. With strong industry ties and modern training, we excel in placing our candidates. Our results speak to our commitment to shaping successful careers. Our approach ensures to open pathway for learners to achieve good growth in the domain
Activities Covered :
Interview Pattern Preparation
Mock Interview Practice Sessions
Preparation as per Job Description
Placement Ready Session for Working Professionals
Technical Screening for technical strengthening
Screening for effective communication check
Placement
Datadrix offers top-notch placement opportunities. With strong industry ties and modern training, we excel in placing our candidates. Our results speak to our commitment to shaping successful careers. Our approach ensures to open pathway for learners to achieve good growth in the domain
Duration
Our 150+ hour data science course offers in-depth training and hands-on experience, covering everything from data collection to advanced analysis and visualization, preparing you to excel in the data-driven world.
Assignments
Our data science course includes assignments that offer hands-on training and cover data collection, analysis, and visualization, equipping you with essential skills for real-world professional success.
Projects
Our data science course features projects that offer practical, hands-on training in data collection, analysis, and visualization, equipping you with essential skills and real-world experience for success.
Live Classes
Our data science course includes live classes offering hands-on training and real-time guidance. From data collection to advanced analysis and visualization, you’ll gain essential skills to excel in today’s tech-driven world.
Classnotes
Our data science course includes detailed class notes that cover data collection, analysis, and visualization, providing the essential skills and practical knowledge needed to excel in the tech-driven world.
Interview Preparation
Our data science course includes targeted interview preparation, covering data collection, analysis, and visualization. This training equips you with the essential skills needed to excel in interviews and succeed in the tech-driven world.
Placements
Our data science course offers dedicated placement support, focusing on data collection, analysis, and visualization. This training equips you with the skills needed to succeed in the tech-driven world and secure your ideal job.
An Awesome Community
Our students, instructors and mentors come from different colleges, companies, and walks of life.
Meet our team and students
Joining DATADRIX means you’ll create an amazing network, make new connections,
and leverage diverse opportunities.
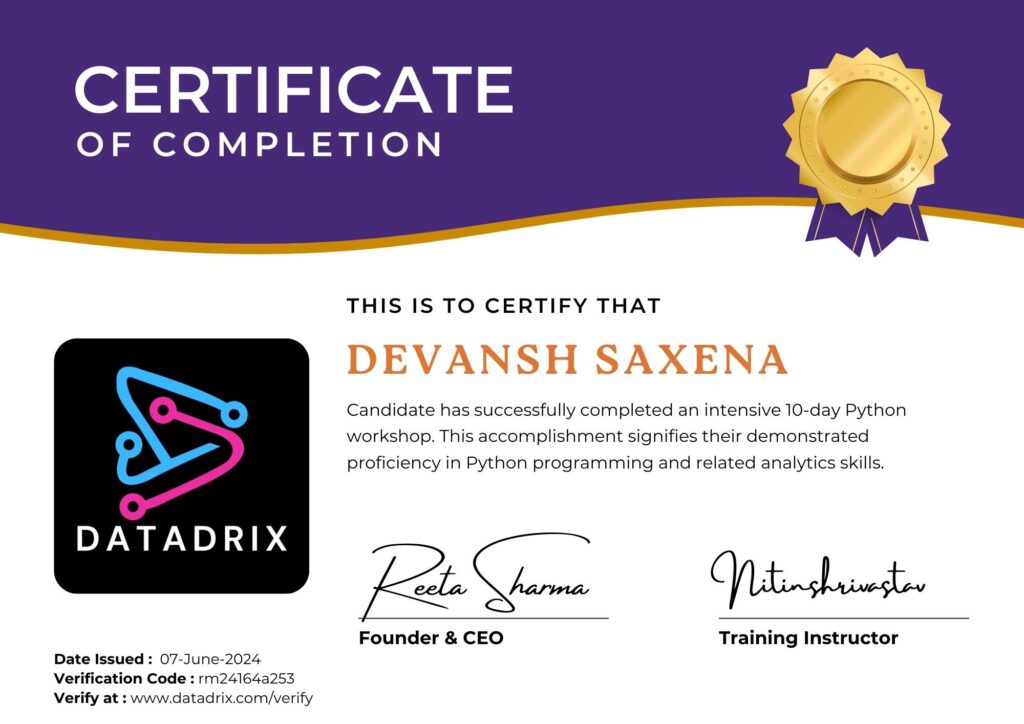
“Validate Your Expertise and Propel Your Career”
- Expand Opportunities: Certifications to unlock new career opportunities, gain credibility with employers, and open doors to higher-level positions.
- Continuous Growth: Certifications not only validate your current skills but also encourage continuous learning and professional development, allowing you to stay updated with the latest industry trends and advancements.
- Certification: A testament to your skills and knowledge, certifications demonstrate your proficiency in specific areas of expertise, giving you a competitive edge in the job market.
Advance Excel Course
Advanced Excel Skills for Data Wizards and Analysts
Elevate your Excel skills to the next level with our Advanced Excel course. In today’s data-driven world, proficiency in Excel is a valuable asset. Our program is designed to empower you with advanced techniques and strategies that will enhance your ability to analyze data, create complex spreadsheets, and make data-driven decisions. Whether you’re a business professional, analyst, or student, this course is tailored to suit all skill levels. Our experienced instructors will guide you through intricate features, such as advanced functions, data visualization, and automation, providing you with the tools to streamline your work and make a significant impact in your career.
This course delves deep into the capabilities of Excel, allowing you to master data management, create dynamic reports, and automate tasks with ease. We cover complex functions like VLOOKUP, INDEX & MATCH, and pivot tables, providing you with the expertise to extract meaningful insights from your data. Moreover, you’ll learn to visualize data effectively, creating interactive dashboards and charts that present information in a compelling and easy-to-understand manner.
Our Advanced Excel course doesn’t just stop at theoretical knowledge. We focus on practical application with real-world exercises and projects that mirror the challenges you’ll face in your profession. By the end of the course, you’ll not only have a deep understanding of Excel but also a valuable portfolio of work that showcases your proficiency. Join us to unlock the full potential of Excel and gain a competitive edge in the world of data analysis and business operations. Your journey towards becoming an Excel expert begins here!
Upon successful completion of our Advanced Excel course, you’ll receive a recognized certification that validates your expertise and sets you apart in the job market. With the ever-growing demand for professionals who can harness the full potential of Excel, you’ll be equipped for a wide range of career opportunities. Join us in this transformative learning journey to become a proficient Excel user, capable of driving efficiency, accuracy, and data-driven insights in your workplace. Excel at Excel with our Advanced Excel course.
In-Demand Skill: An advanced Excel course offers essential in-demand skills for data analysis and manipulation. Participants will learn to harness the power of Excel’s advanced functions, data visualization techniques, and automation tools, enabling them to solve complex business problems, create insightful reports, and make data-driven decisions.
Beginner-Friendly: It’s designed to accommodate learners who are just starting their journey into the world of Excel. This course provides a supportive and accessible learning environment for those with little to no prior experience with advanced Excel functions.
Versatility: This course delves into advanced functions, formulas, and techniques that enable you to perform complex data manipulations, automate repetitive tasks, and create sophisticated reports and dashboards.
Structured Learning: The structured curriculum ensures a step-by-step progression, empowering you to become a proficient Excel user, whether you’re an aspiring data analyst or a professional seeking to enhance your spreadsheet skills.
Hands-On Practice: Through practical exercises and real-world scenarios, you’ll gain proficiency in managing and analyzing data effectively. Whether you’re an aspiring data analyst, business professional, or a student, this course equips you with the practical skills to excel in data management and analysis using Excel’s advanced capabilities
Customized Learning Paths: Our Advanced Excel course offers customized learning paths, allowing you to tailor your learning experience to your specific needs.It’s an opportunity to gain expertise in the Excel skills that matter most to you, enhancing your proficiency and productivity in data manipulation and reporting.
Experienced Instructors: This program is designed for individuals with a foundational understanding of Excel and are looking to elevate their skills to an advanced level. With our instructors’ guidance, you’ll delve into complex Excel features and functions, learning how to perform intricate data analysis, automate tasks, and create sophisticated financial models.
Career Advancement: This specialized training empowers professionals to excel in data-driven roles, enhance decision-making capabilities, and stand out in competitive job markets. It’s a crucial step toward career growth and staying ahead in today’s data-centric workforce
Job Placement Support: What sets our course apart is the commitment to your success. We offer job placement support, connecting you with opportunities that require the expertise you’ve gained..
Community and Networking: The advanced Excel course for Community and Networking is designed to help participants unlock the full potential of Excel in the context of community and network management. This course goes beyond basic spreadsheet skills and delves into advanced techniques and functions that are invaluable for community organizers, network administrators, and professionals in community-based roles.
Certification: Our Advanced Excel Certification course is a comprehensive program designed to take your Microsoft Excel skills to the next level. In this course, you will delve into advanced features and functions, data analysis techniques, and automation tools, empowering you to become an Excel expert.
Continuous Learning: Our advanced Excel course offers a continuous learning opportunity for individuals looking to enhance their spreadsheet skills. It delves into complex functions, data analysis, and automation techniques, allowing learners to become proficient in Excel’s advanced features.
Ongoing Support: Even after completing the training, you’ll have access to resources and support, ensuring you stay up-to-date with the latest developments in Advance Excel.
Embarking on a Advance Excel training journey at DATADRIX is an investment in your future, whether you’re just starting your career or looking to further develop your skills. We welcome both fresher and experienced students to join us and explore the exciting world of IT Technologies.


Frequently Asked Questions
Is powerbi better than ms excel ?
Add context to your column. Help visitors understand the value they can get from your products and services.

Will this covers advance excel part ?
Add context to your column. Help visitors understand the value they can get from your products and services.
Are we able to make dashboards with excel ?
Add context to your column. Help visitors understand the value they can get from your products and services.
Is there any pre-requisite for excel ?
Add context to your column. Help visitors understand the value they can get from your products and services.