

DATADRIX : Data Analytics
Deciphering Data, Illuminating Insights
The course provides comprehensive training in data analysis techniques, tools, and methodologies, equipping students with the skills to derive insights from data. Through hands-on projects and real-world case studies, students learn to manipulate, analyze, and visualize data, gaining practical experience to excel as data analysts in various industries.In today’s data-driven world, the ability to extract actionable insights from vast datasets is invaluable. Our comprehensive program equips you with the essential skills to collect, analyze, and interpret data effectively. Join us and become a proficient data analyst, ready to tackle the challenges of tomorrow’s data-driven opportunities.
Course Curriculum
A syllabus is a meticulously crafted document that serves as a comprehensive roadmap for the training program. It plays a pivotal role in guiding candidate along their learning journey, offering a structured framework for acquiring knowledge and honing skills.
Module 1
Module 2
Module 3
Module 4
Internship Program
This internship is a part of the course curriculum to help you gain real experience in the Data Science domain.During this internship, you will go through various challenges which you allow to explore new skills and push your limits while learning something new during the projects.
Topics Covered :
Integration of python & SQL
Web Scrapping
Data Cleaning with Python
Model Evaluation
Git / Github Integration
End to End Projects
Interview Preparation
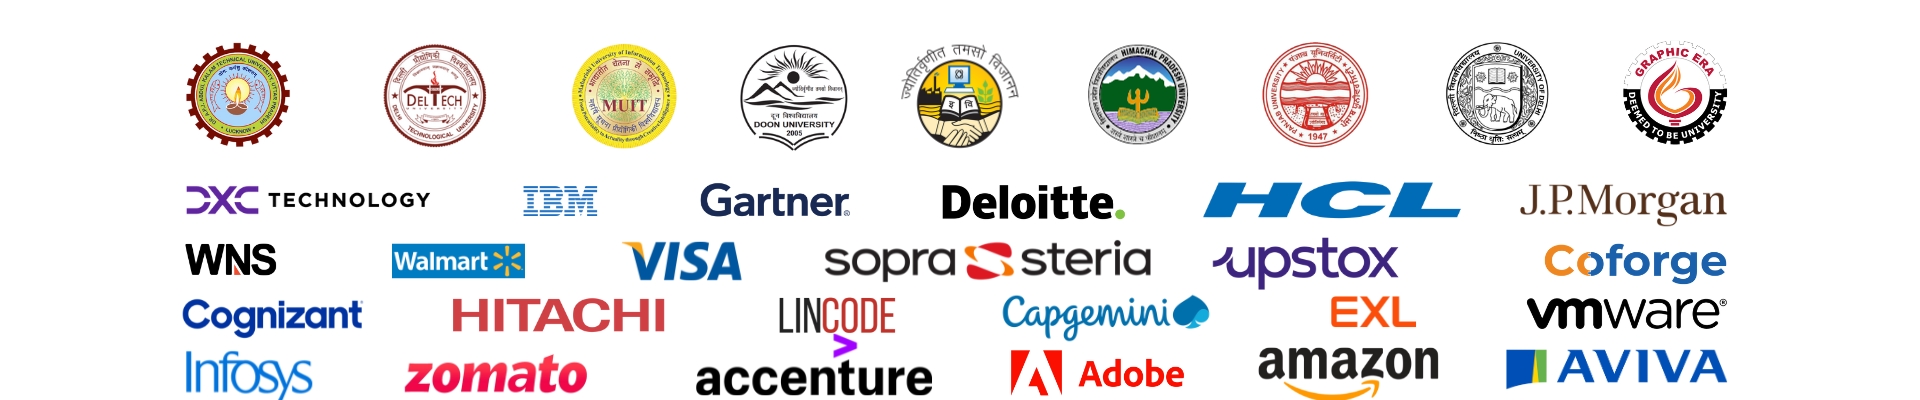
Datadrix offers top-notch placement opportunities. With strong industry ties and modern training, we excel in placing our candidates. Our results speak to our commitment to shaping successful careers. Our approach ensures to open pathway for learners to achieve good growth in the domain
Activities Covered :
Interview Pattern Preparation
Mock Interview Practice Sessions
Preparation as per Job Description
Placement Ready Session for Working Professionals
Technical Screening for technical strengthening
Screening for effective communication check
Placement
Datadrix offers top-notch placement opportunities. With strong industry ties and modern training, we excel in placing our candidates. Our results speak to our commitment to shaping successful careers. Our approach ensures to open pathway for learners to achieve good growth in the domain
Duration
Our 150+ hour data science course offers in-depth training and hands-on experience, covering everything from data collection to advanced analysis and visualization, preparing you to excel in the data-driven world.
Assignments
Our data science course includes assignments that offer hands-on training and cover data collection, analysis, and visualization, equipping you with essential skills for real-world professional success.
Projects
Our data science course features projects that offer practical, hands-on training in data collection, analysis, and visualization, equipping you with essential skills and real-world experience for success.
Live Classes
Our data science course includes live classes offering hands-on training and real-time guidance. From data collection to advanced analysis and visualization, you’ll gain essential skills to excel in today’s tech-driven world.
Classnotes
Our data science course includes detailed class notes that cover data collection, analysis, and visualization, providing the essential skills and practical knowledge needed to excel in the tech-driven world.
Interview Preparation
Our data science course includes targeted interview preparation, covering data collection, analysis, and visualization. This training equips you with the essential skills needed to excel in interviews and succeed in the tech-driven world.
Placements
Our data science course offers dedicated placement support, focusing on data collection, analysis, and visualization. This training equips you with the skills needed to succeed in the tech-driven world and secure your ideal job.
An Awesome Community
Our students, instructors and mentors come from different colleges, companies, and walks of life.
Meet our team & students
Joining DATADRIX means you’ll create an amazing network, make new connections, and Leverage Diverse Opportunities
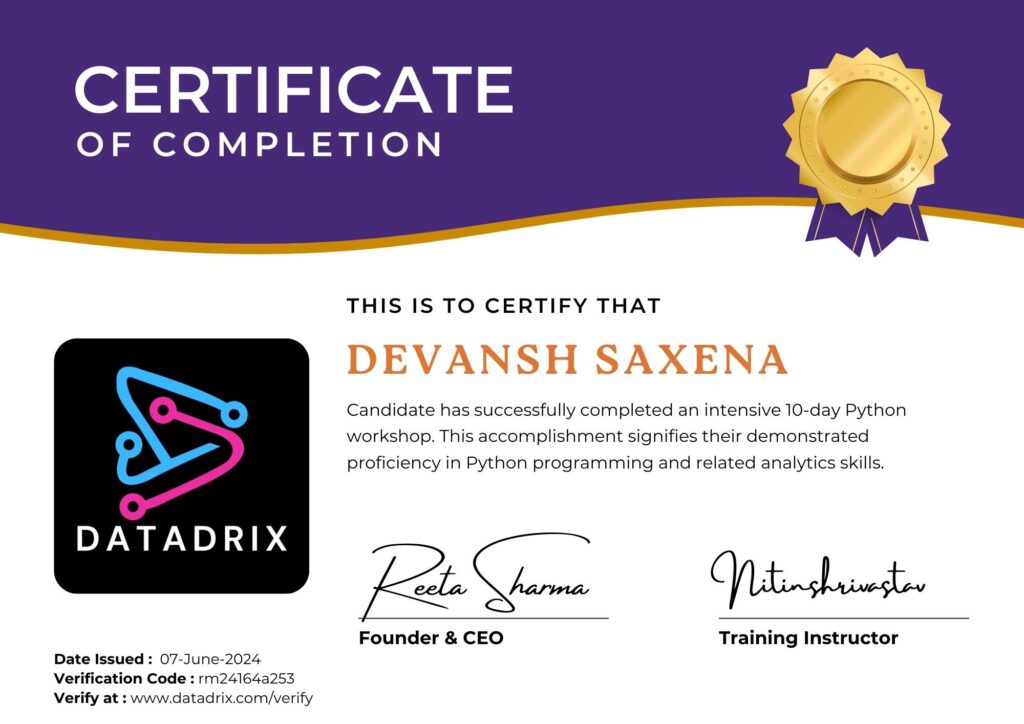
“Validate Your Expertise and Propel Your Career”
- Expand Opportunities: Certifications to unlock new career opportunities, gain credibility with employers, and open doors to higher-level positions.
- Continuous Growth: Certifications not only validate your current skills but also encourage continuous learning and professional development, allowing you to stay updated with the latest industry trends and advancements.
- Certification: A testament to your skills and knowledge, certifications demonstrate your proficiency in specific areas of expertise, giving you a competitive edge in the job market.
Data Analyst
Translating Raw Numbers into Actionable Intelligence
Our Data Analyst course is your gateway to unlocking the power of data in the digital age. In an era where data is at the heart of decision-making in businesses and organizations, being proficient in data analysis is a valuable skill. Our comprehensive program offers a deep dive into the world of data, equipping you with the knowledge and practical expertise required to extract insights from raw information. Whether you’re just starting your career or seeking to enhance your analytical skills, our course caters to learners at all levels. From mastering data visualization to advanced statistical analysis, you’ll gain the tools and confidence to make data-driven decisions that impact the success of any enterprise.
Led by industry experts with years of experience, our Data Analyst course goes beyond theoretical concepts. It emphasizes hands-on learning, enabling you to work with real datasets and apply analytical techniques to solve practical problems. You’ll explore popular data analysis tools and programming languages such as Python and R, becoming proficient in extracting, cleaning, and visualizing data. Our curriculum covers a wide range of topics, including data mining, machine learning, and statistical modeling, ensuring that you’re well-rounded in the field of data analysis. Additionally, we provide guidance on how to effectively communicate your findings through compelling data storytelling.
Upon successful completion of our Data Analyst course, you’ll be awarded a recognized certification, making you a valuable asset in a data-driven world. Whether your career aspirations lie in data science, business intelligence, or decision support, this course will equip you with the skills and credentials to excel in your chosen path. Join us and embark on a learning journey that opens doors to a world of opportunities where your data analysis expertise can influence positive change and innovation in any industry.
In-Demand Skill: A data analyst course provides students with the essential skills to excel in the field of data analysis.This course equips learners with the expertise to transform raw data into actionable insights, making them highly marketable in today’s data-centric job market.
Beginner-Friendly: We start with the basics and gradually build your skills, making complex data concepts easy to understand. This course provides a gentle and supportive introduction to the world of data analysis, ensuring that beginners can confidently learn and apply essential data-related skills.
Versatility: Data analyst course is designed to provide learners with a versatile skill set to effectively work with data in various industries. It equips individuals with the ability to collect, analyze, and interpret data to extract valuable insights, make informed decisions, and solve complex problems..
Structured Learning: You’ll follow a clear path to acquire the skills needed for interpreting data, making data-driven decisions, and mastering data visualization techniques. It’s an organized and systematic approach to building your data analysis expertise.
Hands-On Practice: Our data analyst course focuses on hands-on practice, allowing you to apply what you learn in real-world scenarios. You’ll work with actual data, tackle practical problems, and gain valuable experience in data analysis techniques, data visualization, and decision-making.
Customized Learning Paths: In our Data Analyst course, we offer customized learning paths to cater to your unique needs and prior knowledge. Whether you’re just starting your data analytics journey or seeking to advance your existing skills, our program is tailored to accommodate your level of expertise.
Experienced Instructors: Our Data Analyst course, led by experienced instructors, is designed to help you harness the power of data. With our expert guidance, you’ll dive into the world of data analysis, learning advanced techniques and strategies used in the industry.
Career Advancement: Data analyst course offers a pathway to career advancement by equipping individuals with the skills and knowledge needed to excel in the field of data analysis. It provides a deep understanding of data processing, visualization, and interpretation, which are vital for making informed business decisions.
Job Placement Support: Our Data Analyst course goes beyond teaching you essential data analysis skills. We’re committed to your success, and that’s why we provide comprehensive job placement support.
Community and Networking: Our Data Analyst course not only equips you with essential data analysis skills but also offers a unique opportunity to join a vibrant community of like-minded individuals. Throughout the course, you’ll engage in networking sessions, collaborate on projects, and interact with fellow students and professionals.
Certification: This certification is highly valued in various industries, as data analysts play a critical role in extracting valuable insights from data to drive business improvements, uncover trends, and support strategic planning.
Continuous Learning: Data analyst course promotes continuous learning by providing ongoing opportunities for students to stay updated with the latest trends, tools, and techniques in data analysis. This ensures that graduates are well-prepared to adapt to the ever-evolving data landscape, making them valuable assets in the field of data-driven decision-making.
Ongoing Support: Even after completing the training, you’ll have access to resources and support, ensuring you stay up-to-date with the latest developments in Data Analyst.
Embarking on a Data Analyst training journey at DATADRIX is an investment in your future, whether you’re just starting your career or looking to further develop your skills. We welcome both fresher and experienced students to join us and explore the exciting world of IT Technologies.


Key Features & Benefits

Frequently Asked Questions
What do you understand by Data Analysis Course
Data Analysis Course typically teaches the techniques and tools for collecting, cleaning and interpreting data

What are the roles and responsibilities in data analytics course
Responsibilities include collecting, cleaning and transforming data, performing statistical analysis & presenting actionable insights

What are the Best five steps in data analysis course
Course emphasizes effective communication of findings, teaching students how to present their results concisely
What does Data Analysis and Reporting do in India
Data Analysis and Reporting play a crucial role in various industries, aiding organizations in making informed decisions